Sensitivity Analysis

The EVOLVE workflow uses a distance-based generalized sensitivity analysis (dGSA) (Fenwick et al., 2014). The concept is straightforward. It compares the cumulative distribution function (CDF) of each parameter in each cluster to the CDF of the entire population (all clusters). If the differences are statistically significant, the parameter is deemed to be sensitive for the distance metric selected, otherwise it is insensitive. |
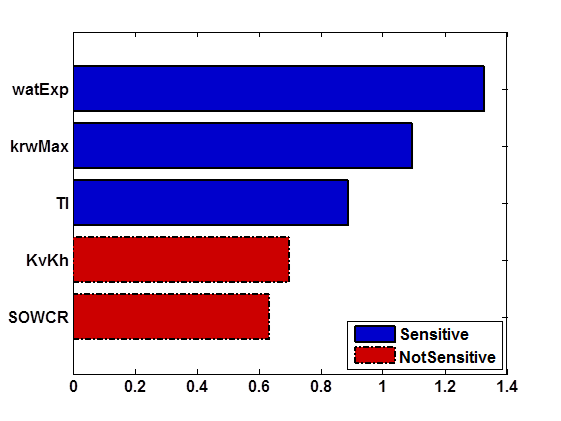
Advantages to Generalized Sensitivity Analysis:
|
 Use novel, intuitive sensitivity analysis using metric space methods. Use novel, intuitive sensitivity analysis using metric space methods.
Novel procedure provides alternative, complimentary technique to traditional sensitivity analysis
|
Contact in USA
Corporate Headquarters 
StreamSim Technologies, Inc.
865 25th Avenue
San Francisco, CA 94121
U.S.A.
Tel: (415) 386-0165
Contact in Canada
Canada Office 
StreamSim Technologies, Inc.
Suite 102A - 625 14th Street N.W.
Calgary, Alberta T2N 2A1
Canada
Tel: (403) 270-3945