Reservoir Pattern Surveillance
![]()
Use studioSL's data-driven surveillance technology to make low-cost operational decisions on mature floods. Our surveillance workflow provides ROIP distributions, forecasts of rate targets, shut-ins, reactivations, and/or producer-2-injector conversions. There is no tedious history matching, meaning that you can rapidly go from model inputs to model forecast results.
For the 16th Matzen field peripheral waterflood in Austria, surveillance along with our floodOPT workflow resulting in an oil production increase of 3% (35,000 stb) in one year, the Belridge field in California showed a reversal in oil decline, the Wilmington field in California reduce oil decline from 20% to 2% over one year, in the 8th Tortonian in Austria incremental oil production was 35,000 STB in 30 months, and in Argentina the oil decline for a water flood was reduced from 16% to 0% for the following 3 months.
More Info:Brochure,Pricing,SPE-Webinar, Surveillance Book, YouTube Videos
Support:Knowledge Base,Tutorials,Training
The Reservoir Surveillance Workflow
|
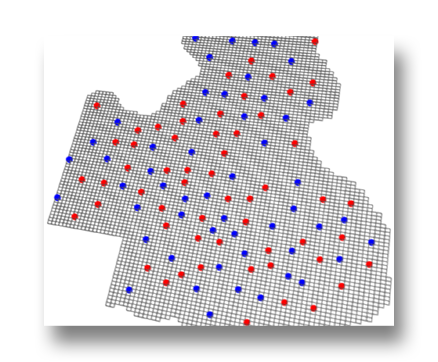
Well locations, production history, and geology. Import historical production, well locations, and perforation data from OFM, Petrel, geoSCOUT, or AccuMap. Import 2D Zmaps from Petrel or Petra to build a 2D or 3D grid, or directly import a 3D geomodel from Petrel, Skua-Gocad, or other geomodeling software using Eclipse-like grid formats. |
|
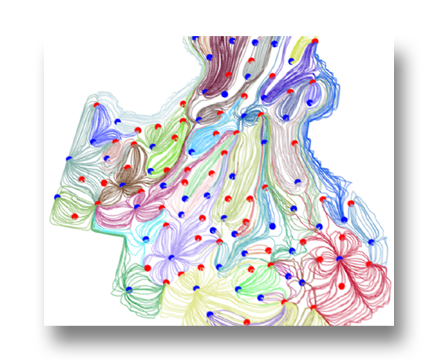
Compute streamlines. With well locations, the injection and production history, and a grid defined, calculate the streamlines throughout history. The image to the left shows streamlines, as colored by originating injector, for one time interval only. Because historical well rates change, streamlines are computed at each timestep that history is defined at. Surveillance does not involved the transport of fluids along the streamlines so calculations are fast and efficient. |
|
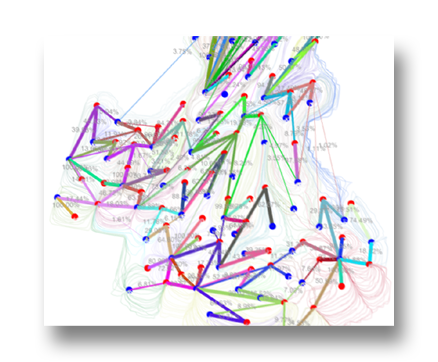
Flux Pattern Map.Collapse the streamline bundles between each well-pair and represent this as a graph. This is Streamsim's patented (US Patent 6,519,531)Flux Pattern Map to quantify the strength and the allocation factors between wells. Since streamlines change with time, so too will the FPmap, giving a dynamic pattern picture of your flood. These maps can be combined for a range of timesteps to then represent average patterns and average allocation factors over the time range. |
|
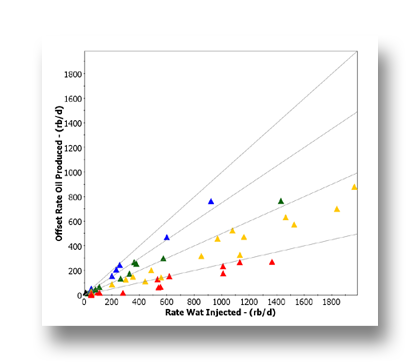
Injection Efficiency.Once well-pairs are identified and the well-rate allocation factors are calculated, studioSL can summarize the performance of the injectors via an injector efficiency plot. Each point on the plot represents an injector and is associated with an offset oil rate produced on the y-axis. The IE-plot is powerful diagnostic of the efficiency of each injector in a field. |
|
Target Rates. Using the injection efficiency associated with each well-pair, new well rates can be computed to promote good connections and demote poor connections using floodOPT. A plot/listing of suggested new well rate targets calculated by floodOPT represents a strategy to improve sweep and demote cycling. Delta target rates changes shown in figure at right represent total voidage increases and decreases for injectors (cyan) and producers (green). The calculation can be additionally be driven by field-wide constraints and individual well constraints. The output is also helpful to identify key wells--those with the largest delta changes--on which to focus initial efforts to improve flood performance. |
|

|
ROIP Distribution.Given an Original Oil in Place (OOIP) distribution, apply Streamsim's unique streamline region based material balance (SLR-MB*) simulator on each dynamic well-pair to generate a Remaining Oil in Place (ROIP) distribution. This will highlight areas of low vs high ROIP as driven by the injection/production history. Shown on the right is a comparison between the OOIP and the ROIP after integrating all the historical production into per-pattern material balance calculations. Red areas are high values, blue areas are low values, and purple areas are zero values where gas cap or water zones are located. * SLR-MB is protected by US patent No. 10,726,173 B2 |
|


 |
Rapid Forecasting. Using regression techniques, historical well rates are correlated to local grid properties to compute individual well-level forecast of oil, water, and gas rates. This is useful for rapid forecasting of existing well base declines, shut-ins, reactivations, or producer-to-injector conversions. Forecasting of a surveillance model can also be combined with Streamsim's floodOPT workflow to forecast the impact of new well rate targets that promote sweep and demote fluid cycling. |
|

For a short white paper on field results with our technology, please see here. See our knowledge base item for more information on a Flow-Based Surveillance model vs a Flow Simulation model here.
See our April 2008 SPEREE paper or our JPT Jan 2010 Distinguished Authorarticle for additional technical details.
Contact in USA
Corporate Headquarters 
StreamSim Technologies, Inc.
865 25th Avenue
San Francisco, CA 94121
U.S.A.
Tel: (415) 386-0165
Contact in Canada
Canada Office 
StreamSim Technologies, Inc.
Suite 102A - 625 14th Street N.W.
Calgary, Alberta T2N 2A1
Canada
Tel: (403) 270-3945