Reservoir Pattern Surveillance
Use studioSL's data-driven surveillance technology to make low-cost operational decisions on mature floods. Our surveillance workflow provides ROIP distributions, forecasts of rate targets, shut-ins, reactivations, and/or producer-2-injector conversions. There is no tedious history matching, meaning that you can rapidly go from model inputs to model forecast results.
The Reservoir Surveillance Workflow
Use studioSL's data-driven surveillance technology to make low-cost operational decisions on mature floods. Our surveillance workflow provides ROIP distributions, forecasts of rate targets, shut-ins, reactivations, and/or producer-2-injector conversions. There is no tedious history matching, meaning that you can rapidly go from model inputs to model forecast results.
For the 16th Matzen field peripheral waterflood in Austria, surveillance along with our floodOPT workflow resulting in an oil production increase of 3% (35,000 stb) in one year, the Belridge field in California showed a reversal in oil decline, the Wilmington field in California reduce oil decline from 20% to 2% over one year, in the 8th Tortonian in Austria incremental oil production was 35,000 STB in 30 months, and in Argentina the oil decline for a water flood was reduced from 16% to 0% for the following 3 months.
More Info:Brochure,Pricing,SPE-Webinar, Surveillance Book, YouTube Videos
Support:Knowledge Base,Tutorials,Training
Well locations, production history, and geology
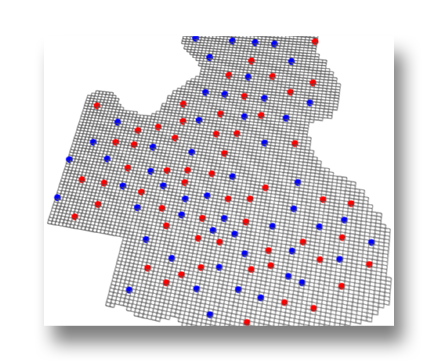
Import historical production, well locations, and perforation data from OFM, Petrel, geoSCOUT, or AccuMap. Import 2D Zmaps from Petrel or Petra to build a 2D or 3D grid, or directly import a 3D geomodel from Petrel, Skua-Gocad, or other geomodeling software using Eclipse-like grid formats.
Compute streamlines
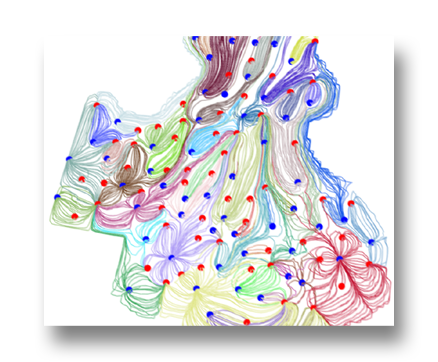
With well locations, the injection and production history, and a grid defined, calculate the streamlines throughout history. The image to the left shows streamlines, as colored by originating injector, for one time interval only. Because historical well rates change, streamlines are computed at each timestep that history is defined at.
Surveillance does not involved the transport of fluids along the streamlines so calculations are fast and efficient.